With that in mind, it is an appropriate time to take stock of where we are. As markets have changed, so has the performance of portfolios. We are pleased with returns generated for clients in this changing environment.
One way to gauge relative performance is to compare ourselves with the peer group.
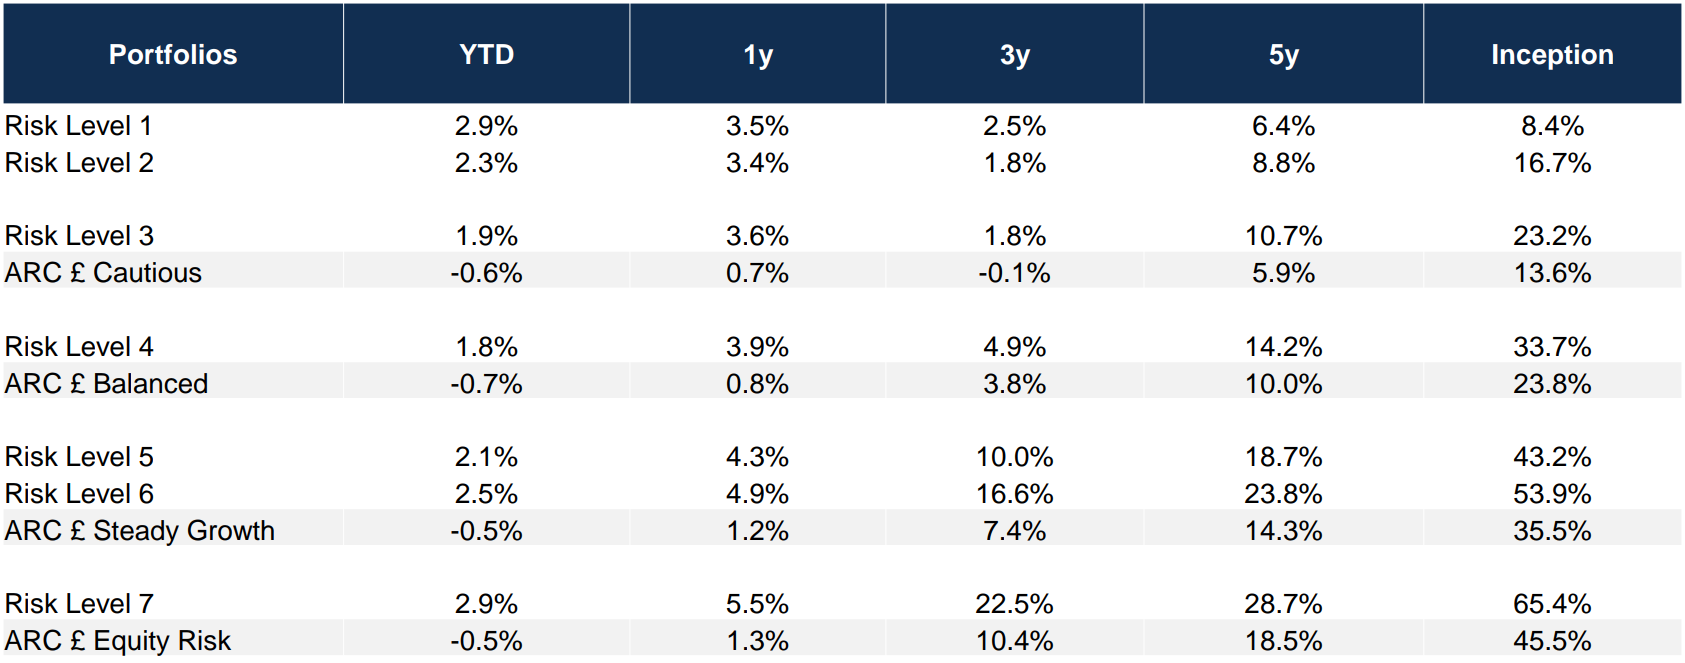
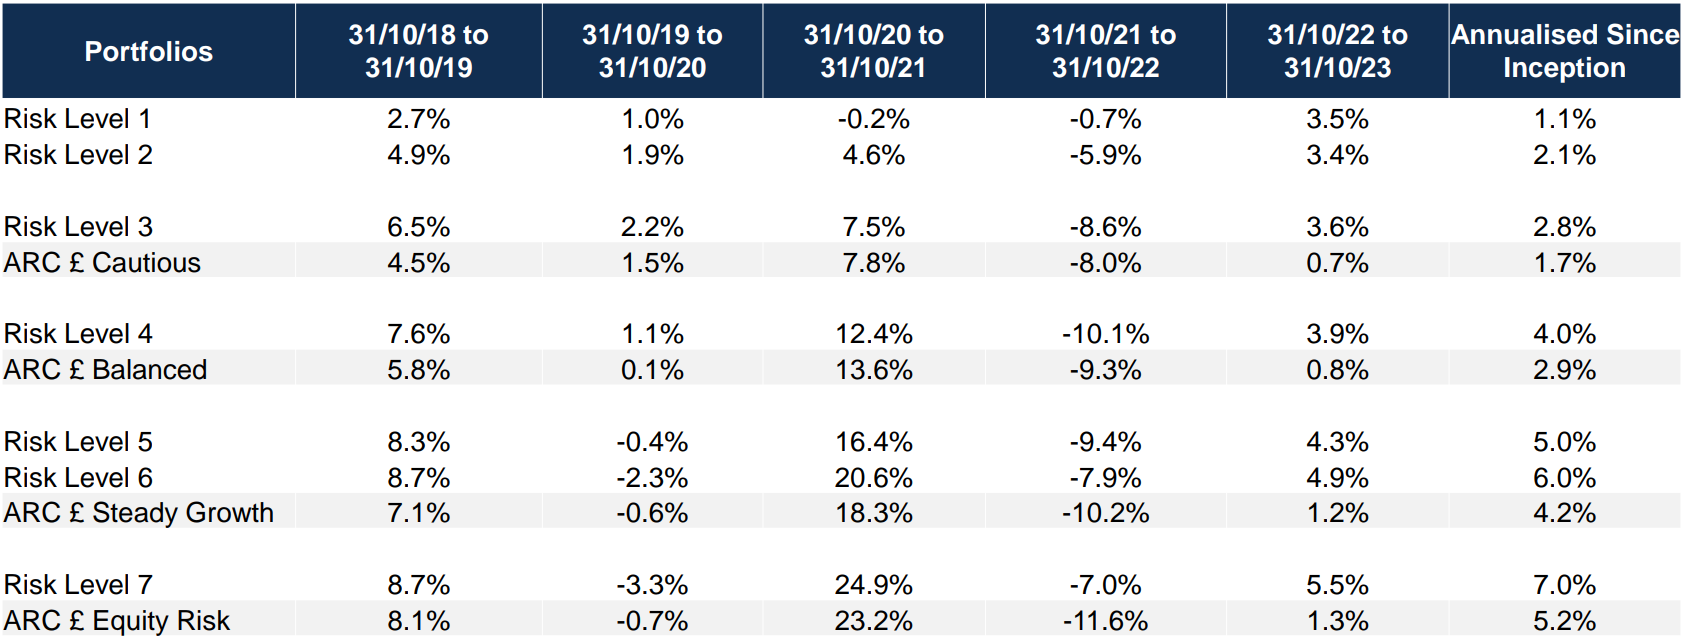
Indeed, when we compare the returns of our core sterling portfolios with the peer groups run by Asset Risk Consultants (ARC), every strategy has outperformed the relevant peer group in every period, covering year to date, one year, two years, three years, five years and since inception in May 2016. In other words, Netwealth portfolio performance has beaten peers in all 30 out of 30 comparison points (5 strategies over 6 time periods), as shown in the table below.

These figures refer to the past, and past performance is not a reliable indicator of future results.
Source: Bloomberg, Asset Risk Consultants & Netwealth Investments. ARC data contains estimates for peer groups for October 2023.
Returns are of indicative live portfolios and are shown net of (i) all charges associated with the underlying investments and (ii) a Netwealth management fee of 0.35% per annum covering management, trading, custody and administration up to 30/04/2023 and 0.40% from 01/05/2023. Netwealth fees range from 0.70% - 0.40% pa depending on account size. ARC data can contain up to 3 months of performance estimates.
Performance in discrete annual periods

These figures refer to the past, and past performance is not a reliable indicator of future results.
Source: Bloomberg, Asset Risk Consultants & Netwealth Investments. ARC data contains estimates for peer groups for October 2023.
Returns are of indicative live portfolios and are shown net of (i) all charges associated with the underlying investments and (ii) a Netwealth management fee of 0.35% per annum covering management, trading, custody and administration up to 30/04/2023 and 0.40% from 01/05/2023. Netwealth fees range from 0.70% - 0.40% pa depending on account size. ARC data can contain up to 3 months of performance estimates.
Looking forward, what has changed?
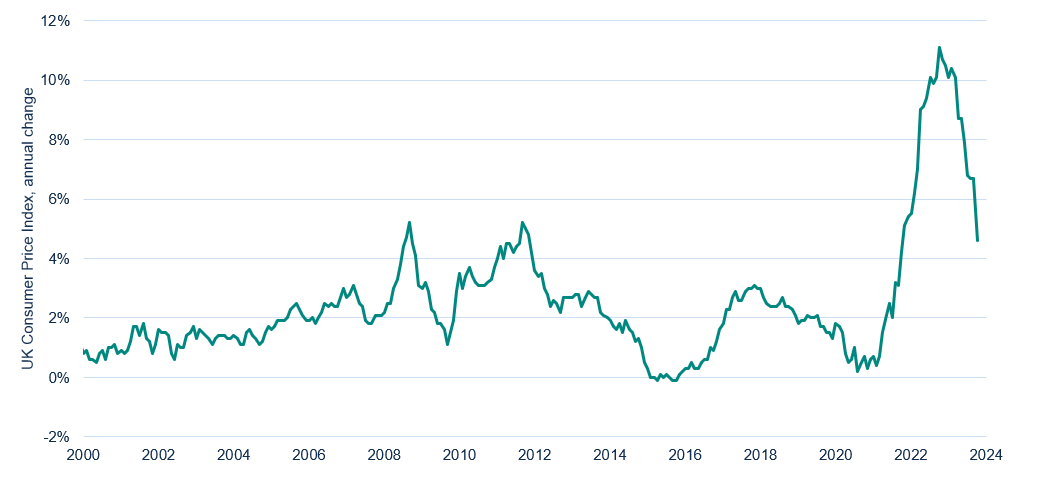
Having persisted for longer than financial markets anticipated, UK inflation data has decelerated since peaking last autumn. Although an annual rate of 4.6% in October represents a much better backdrop than a few months ago, the cumulative effect on spending power is worth noting: consumer prices are 22% above what they were in January 2020.
UK inflation rate is slowing from extreme levels

Source: Bloomberg
Alongside positive surprises from the US, bond markets have taken much comfort from this new trend. Yields have fallen across the board, boosting prices. Although policymakers insist they maintain a bias to tighten further, markets are sending a signal that central banks are being too cautious now. This is the opposite of 2021, when markets eventually highlighted increasing inflationary pressures to complacent central bankers.
As we mentioned to clients in the summer, holders of cash should be vigilant. Although cash levels are attractive now, they could be unable to invest in the future at current market pricing if the inflation backdrop continues to improve; there is an opportunity cost in sitting on the sidelines. The recent shift in the mood in the markets reinforces this point.
Over the past year, in recognition that yields above expected inflation are at levels not seen since before the 2008 Global Financial Crisis, we have raised our expected future returns across the spectrum of fixed income markets. However, in the immediate term our bias is to focus portfolio attention on short-dated, high-quality bonds. Unusually, longer-dated bonds currently offer lower levels of yield than bonds with shorter maturities. We expect this relationship to normalise over time.
Within equities, investors face a dilemma. As we have written before, there is a distinct choice now between assets offering attractive value versus those with anticipated strong earnings delivery and resulting price momentum. In an ideal world, portfolios would only invest in markets capturing all three characteristics.
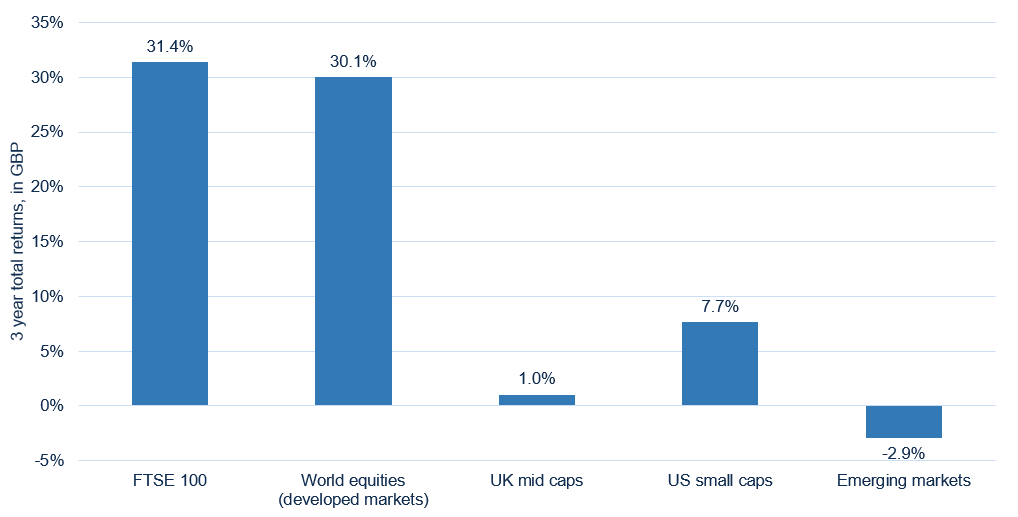
As it is, we continue to blend assets with complementary characteristics, offsetting each other at a point of economic inflexion. UK and global equity markets are good examples of this: although total returns have been similar over the past three years, the path towards that return has been very different because of different types of companies that dominate the markets as well as local factors.
UK equities have matched global ones, while small companies have trailed

Source: Bloomberg, data as of 21st November 2023. Returns shown in GBP terms of leading ETFs tracking the relevant indices, net of fees.
On the face of it, equity market performance overall has been strong, but this masks large portions where pessimism reigns, creating value opportunities. Throughout the year we have looked at different markets to see if the elastic band of cheap pricing has stretched too far. UK commercial property and infrastructure, where we have held zero direct exposure, are extreme examples.
More widely, the fundamentals of small and medium sized companies globally have been hit hard by higher borrowing costs, and greater exposure to the economic cycle. Global emerging markets have been even worse. At current valuations, the opportunity can be appealing, but without a reason for the fundamentals to improve, ‘cheap can often get cheaper’.
Please note, the value of your investments can go down as well as up.


