
What is a benchmark?
A benchmark is a way of measuring how individual components compare to a group of their peers. For example, in the investment world, the FTSE All-Share Index in the UK and the S&P 500 Index in the US are often used as a benchmark for equity managers, as each index is comprised of the largest companies in their respective market. Although we compare ourselves to a range of different multi asset strategies, we think the most relevant benchmarks for UK wealth management firms are provided by the ARC indices.
What are the ARC indices?
Suggestus Asset Risk Consultants, often abbreviated to ARC, are a well-known third party who once a month estimate the investment returns of over 100 wealth managers in the UK to produce peer group average figures across four different risk levels. These averages are shared in their Private Client Indices (PCI), creating estimates for monthly performance within a week of month's end, before finalising the aggregated manager numbers each quarter, one month in arrears.
Why do we include a comparison with ARC in our performance?
We include these figures in our performance charts and tables so that our clients can draw like-for-like, fair and accurate comparisons, using real data from our peers to provide relative statistics once fees have been taken into account.
A common mistake when assessing the performance of an investment service is to compare apples with pears. For example, comparing our Risk Level 4 portfolio (a medium risk mix of equities, bonds and commodities built for sterling investors) with a higher risk global equity index. Or to draw conclusions on performance over two different time periods inadvertently. Including the ARC indices alongside our performance allows you to compare apples with apples.
Are relative or absolute comparisons better?
Comparing Netwealth's returns to their respective ARC Private Client Index is a relative comparison. Comparing them to something with no investment market risk, such as bank interest rates, is more of an absolute comparison of performance.
In times of positive market performance, it is tempting to make absolute comparisons but this would never be done in periods of negative markets.
We therefore suggest being consistent and making relative comparisons at all times. This helps our clients think about the context of our portfolio returns, stick to their long-term plans and avoid falling into traps such as trying to time markets. If your goal is to build wealth for the longer term, we are confident this approach will help you to make better decisions. After all, we know that remaining invested over time is a key part of achieving financial and investment goals.
How do our apples fare in the orchard?
The chart and table below indicate how we have performed against the Suggestus ARC Private Client Indices over different timeframes and at different levels of risk. They show that consistency forms the stable core of our investment approach – across different periods, and as we proactively adapt our asset mixes to help investors achieve their objectives.
Performance since inception, compared to our peer group (as at 31/01/24)
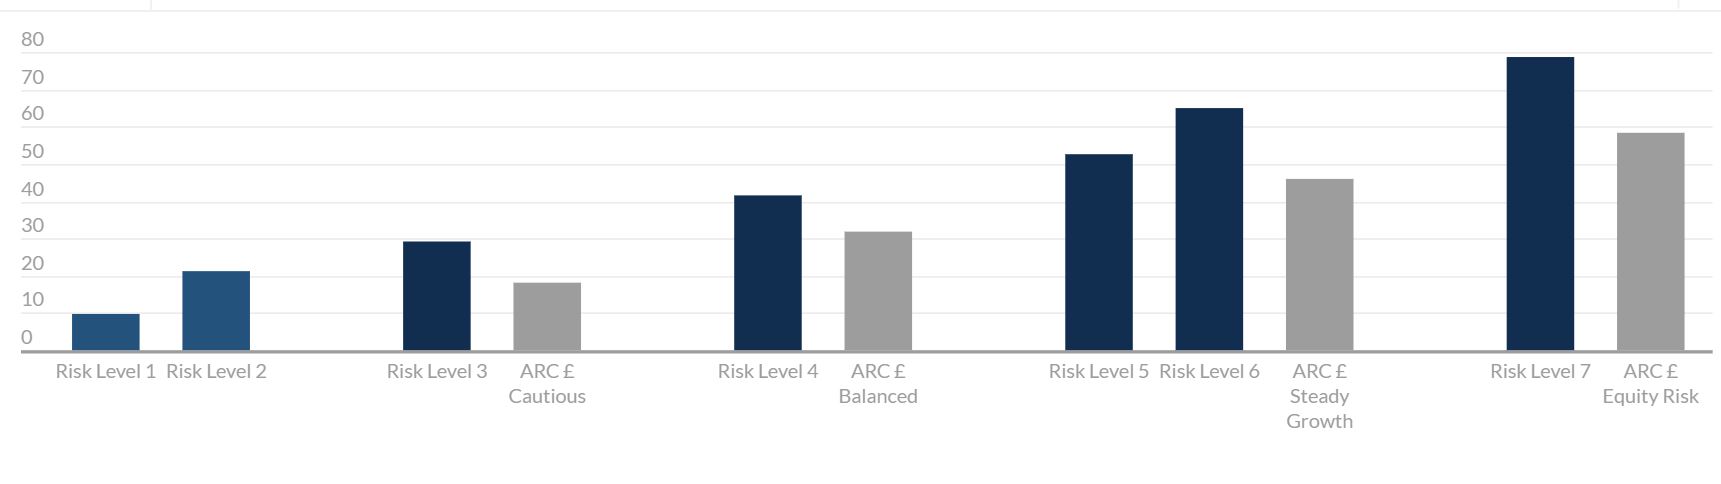
These figures refer to the past, and past performance is not a reliable indicator of future results.
Data to 31/01/2024. GBP portfolio inception: 31/05/2016. No data is available for previous periods. Source: Bloomberg, Asset Risk Consultants & Netwealth Investments. Returns are of indicative live portfolios and are shown net of (i) all charges associated with the underlying investments and (ii) a Netwealth management fee of 0.35% per annum covering management, trading, custody and administration up to 30/04/2023 and 0.40% from 01/05/2023. Netwealth fees range from 0.70% - 0.40% pa depending on account size. ARC data can contain up to 3 months of performance estimates.
Performance over 12 month periods, compared to our peer group (as at 31/01/24)
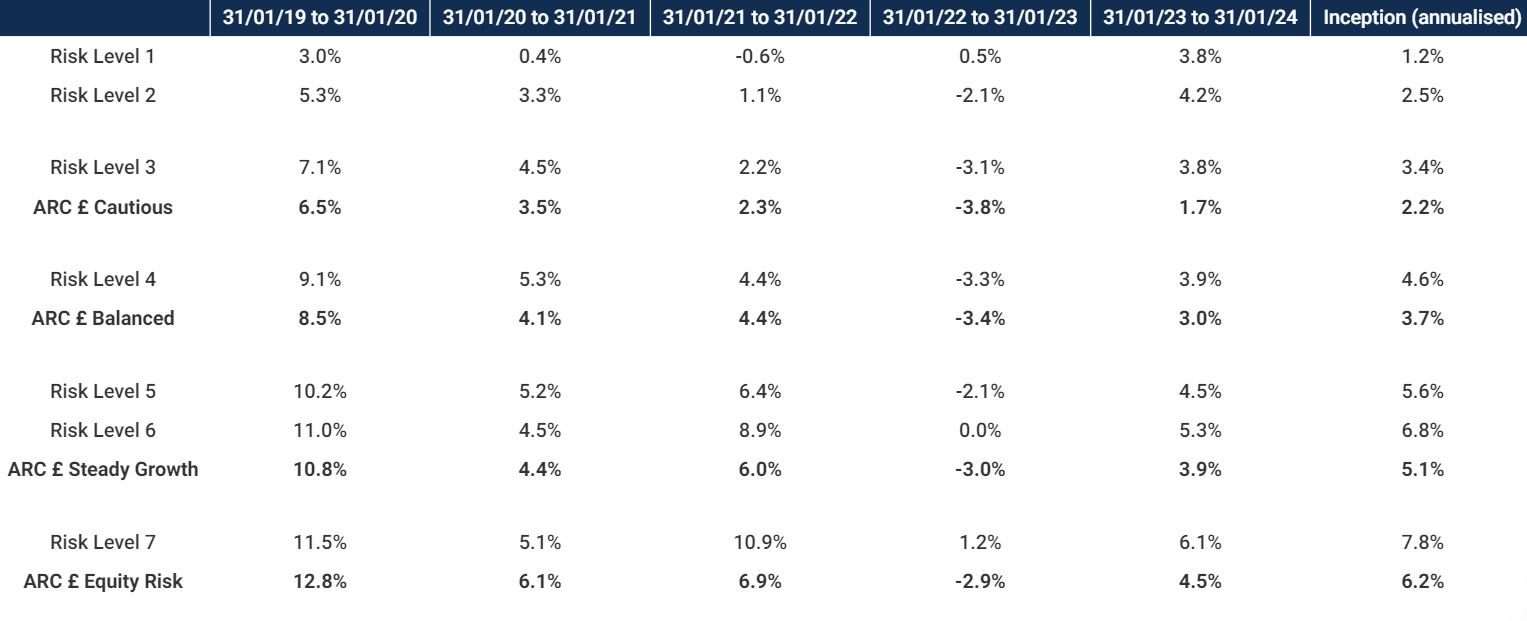
These figures refer to the past, and past performance is not a reliable indicator of future results.
Data to 31/01/2024. GBP portfolio inception: 31/05/2016. No data is available for previous periods. Source: Bloomberg, Asset Risk Consultants & Netwealth Investments. Returns are of indicative live portfolios and are shown net of (i) all charges associated with the underlying investments and (ii) a Netwealth management fee of 0.35% per annum covering management, trading, custody and administration up to 30/04/2023 and 0.40% from 01/05/2023. Netwealth fees range from 0.70% - 0.40% pa depending on account size. ARC data can contain up to 3 months of performance estimates.
This approach, with its focus on sensible, diversified and liquid portfolio construction (while minimising the attritional cost of high fees) compounds market returns faster than our peers. This has led us to outperform a lot more frequently than not.
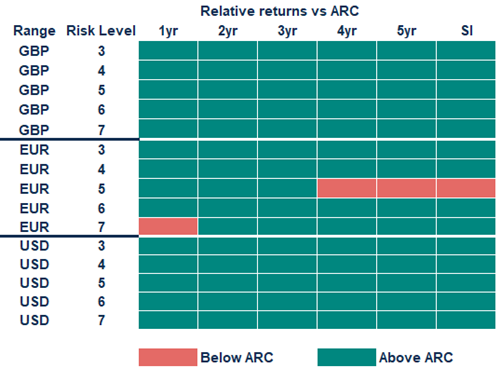
These figures refer to the past, and past performance is not a reliable indicator of future results.
Data to 31/12/2023. GBP portfolio inception: 31/05/2016. No data is available for previous periods. Source: Bloomberg, Asset Risk Consultants & Netwealth Investments. Returns are of indicative live portfolios and are shown net of (i) all charges associated with the underlying investments and (ii) a Netwealth management fee of 0.35% per annum covering management, trading, custody and administration up to 30/04/2023 and 0.40% from 01/05/2023. Netwealth fees range from 0.70% - 0.40% pa depending on account size. ARC data can contain up to 3 months of performance estimates.
Find out more
Comparisons provide valuable context. You can discover more about the Suggestus ARC private client indices that we use on their website here. We will always provide their figures in our performance updates so you can see how we are doing within a broader industry perspective.
It’s all very well for a company like ours to say we delivered total returns of 78.5% after fees since we started over 7 years ago, including some quite challenging times. Yet to show what that means compared to our peers – across different levels of risk – can help investors make choices that are more relevant to them.
If you want to find out more about how we can help you to reach your investment goals, please get in touch.
Please note, the value of your investments can go down as well as up.

