
Portfolio construction in action
Three components underpin how we construct and adapt our portfolios for clients. In essence, we take three different decisions on an ongoing basis.
The first one, and arguably the most important, is setting the strategic allocations that the portfolios follow. This is essentially the mix of assets we think best fits a given risk profile (from 1 to 7). We must consider what combination of different investments (or asset classes) are we happy with investing on a long-term basis to deliver the different returns that markets have to offer. We reappraise these decisions on an annual basis, but we’re really thinking about what different asset classes will do over the coming seven to ten years or so in shaping that process.
Active multi-asset allocation with primarily passive implementation
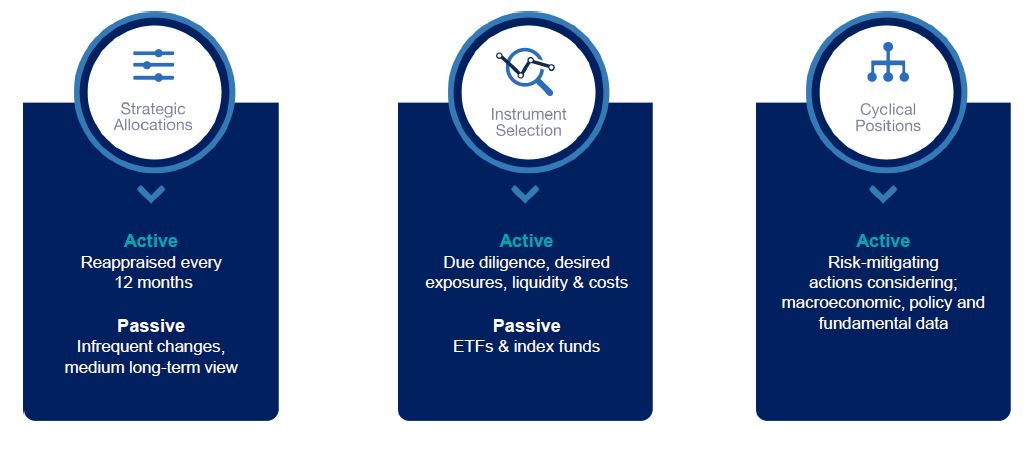
The second aspect is how we fill each one of those spaces in a portfolio – called instrument selection. Our approach is predominately passive. That means we invest in instruments, either funds, or exchange traded funds (ETFs), which try to replicate the return of a particular benchmark index (eg, the FTSE 100) rather than trying to beat the market return. Historic evidence suggests it’s very difficult to continually outperform different indices. Even very skilled fund managers struggle to do it consistently and we don’t believe that’s where our skill base lies.
The third part is thinking about how we might adapt our portfolio on an ongoing basis. So at a given point in time, if there is a particular risk within markets we think we can identify, and also mitigate, then we will adjust the portfolio exposures appropriately. We call that cyclical positioning.
Our overall ethos, however, is to make sure we are investing as efficiently as possible. That means putting together portfolio strategies which are replicated across all our different client portfolios in a very scalable way. Therefore, our own costs are kept down in addition to the low costs that come from passive implementation. Combined with a well-thought-through allocation process, that tailwind of efficient implementation is really what stands us apart in terms of the performance we have delivered.
Exposure summary – where our portfolios invest now
Below we show the exposure of our portfolios now, ranging from risk level 1 to risk level 7. You can see a transition from money markets, cash and short-dated government bond exposure on the left of the chart, to a greater exposure to growth-sensitive assets of equity on the right. Alternative assets such as commodities and gold are most concentrated in the middle of the range of portfolios. These aim to offset different risks that are inherent in the two main asset classes of fixed income and equities.
Where we invest across risk levels now
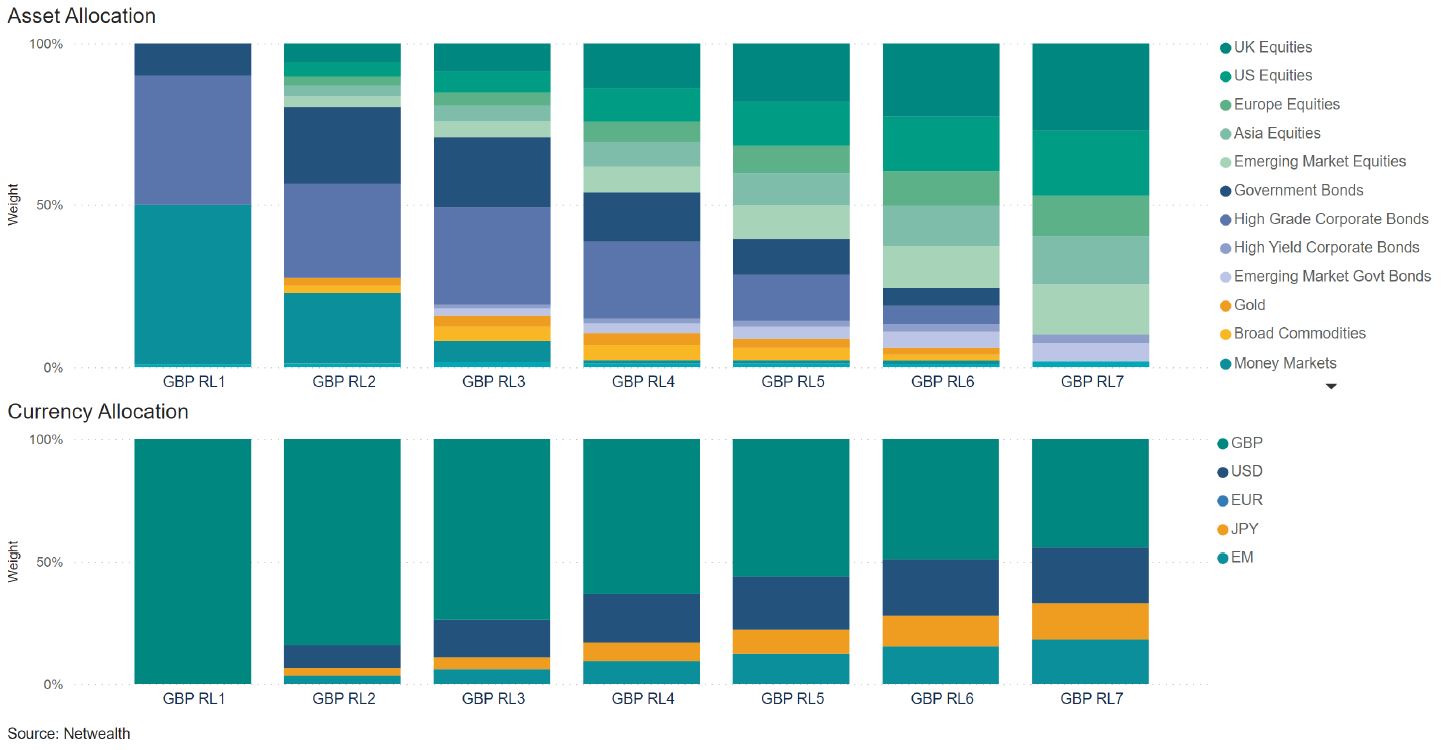
We separate out the currency allocation decision. In the above example of our sterling portfolio range, you can see that the allocation to international currencies increases as you move up the risk spectrum. (This is also a feature of euro and US dollar denominated portfolios.)
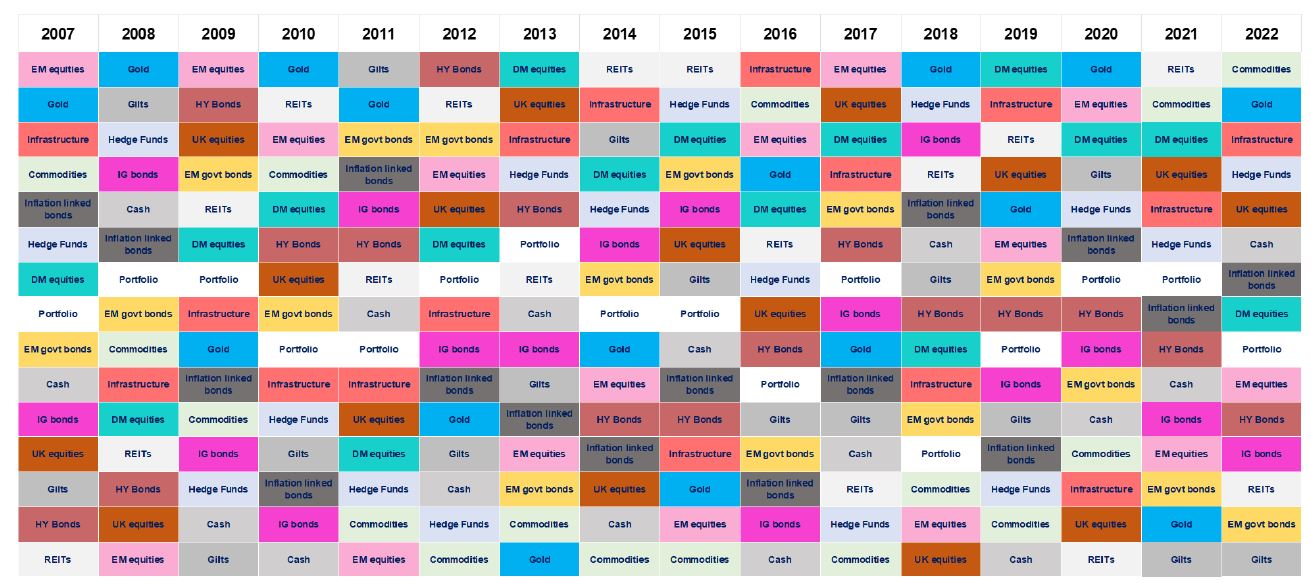
Protection through diversification
Diversification is a key focus when managing portfolios. At the simplest level you may have heard the adage of not putting all your eggs in one basket – and that’s really the job of portfolio construction. We don’t know what will happen to markets at any moment, but we do know it’s important to protect against different events. The idea is that you need diverse components in your portfolio that respond differently to a changing environment.
This chart below is quite chaotic by design – known as a market returns quilt because of the many different colours. It demonstrates an annual ranking of returns in different asset classes going back to 2007, with the best asset class of each year in the top row, and the worst at the bottom.
Protection through diversification
Past performance is not indicative of future results.
Source: Netwealth, Bloomberg. Market returns in GBP, with some asset classes reflecting currency hedging. Portfolio returns calculated using Netwealth GBP Risk Level 4 Portfolio returns, net of fees since launch on May 31st 2016, and by simulated returns of the Netwealth GBP Risk Level 4 strategic allocations prior to May 31st 2016.
Different colours appear in different places, which shows that different asset classes perform better at different times. It’s very difficult to anticipate which asset class is going to perform best in the near term – but what we do know, however, is certain relationships exist typically through time. The relationships may change a little, but we usually have a good understanding of what works well with each other.
The main takeaway, however, from this chart is to focus on the white ‘Portfolio’ boxes dotted around the middle of the spectrum in each year. These illustrate the returns of a medium risk level portfolio through time. It is never the top asset class, nor the bottom – this means that returns become a little bit more predictable in a changing environment.
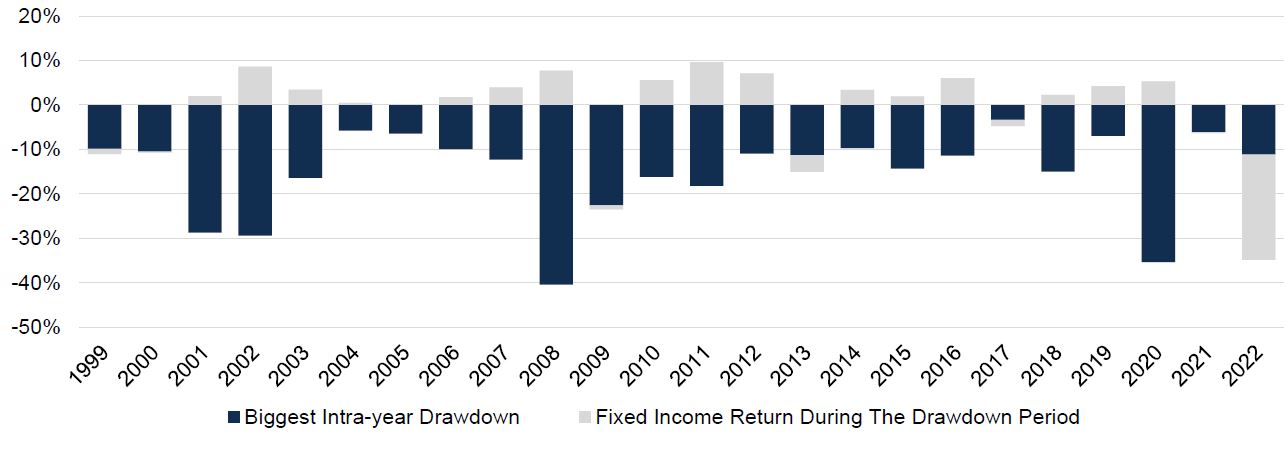
The role of bonds: counteracting negative equity markets
An important thing to remember is that although we don’t know when different asset classes will perform well, we should be prepared for the risk that they deliver unpleasant experiences at any given point in time. Below we look at the biggest intra-year declines (importantly, not where the market ended the year) of the stock market in a given year (in blue), while the grey bars show what happened to fixed income in those different years.
UK fixed income tends to give positive returns during equity drawdowns (declines)
Past performance is not indicative of future results.
Source: Netwealth and Bloomberg. Total returns in GBP. Please remember when investing your capital is at risk.
Typically, when equity markets have fallen the most during a year (showing the most volatility) then the grey bars tend to be the biggest. What’s interesting is to the right of the chart, because what happened in 2022 is decidedly atypical.
Because of a low starting point of fixed income bond yields, they couldn’t offer the same level of protection as we’ve seen historically. We made some changes to account for that but it’s important to understand that any rules you think apply within markets can be broken at any time. So we need to be disciplined in our approach, but remain flexible enough to understand that circumstances can command a change in perspective.
Strategic allocations – and why we should remember stock markets are not all the same
It’s also important to look a little deeper, below the top level of markets, and acknowledge that not all stock markets are the same.
Below we take an extreme example: highlighting US and emerging market (developing country markets) indices. We show the total returns going back over the past 20 years of these two broad market exposures, in pound sterling terms.
The experience has been dramatically different. The US equity market (light blue line) has performed extremely strongly ever since the global financial crisis and has outstripped the returns of all other major market indices. It has outperformed emerging markets over the past 10-12 years by almost 10 percent per annum, which is quite astonishing.
Remember: stock markets are not all the same
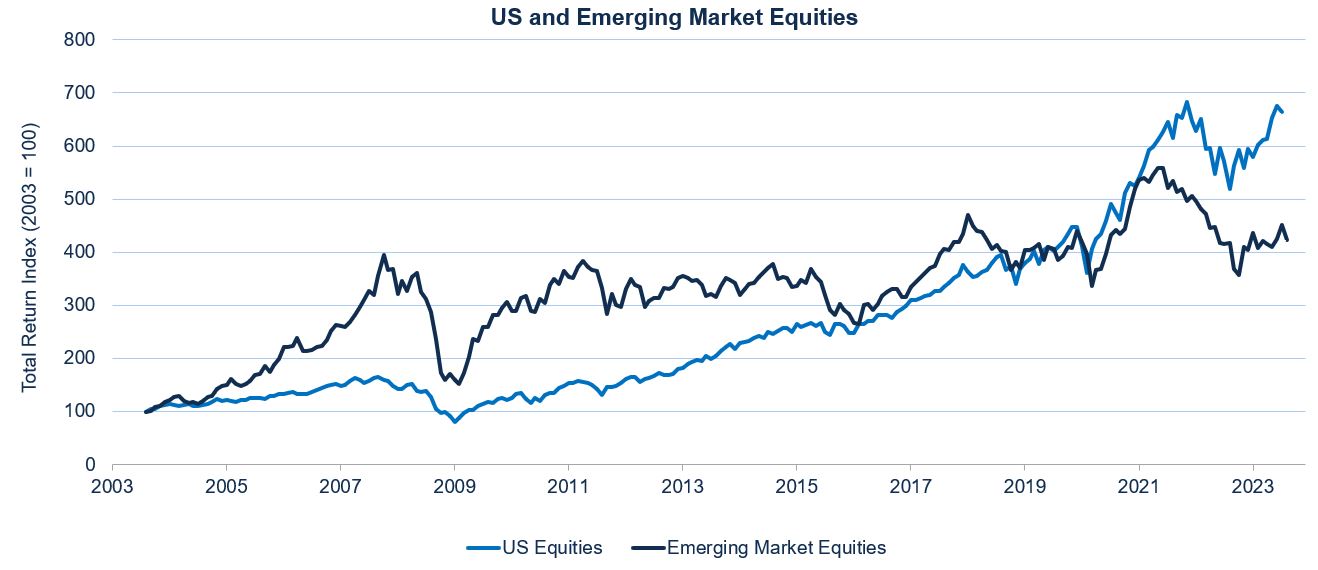
Past performance is not indicative of future results.
Source: Bloomberg, MSCI with Netwealth calculations. Equity index returns shown in GBP terms, from 30th September 2003.
The emerging market experience has obviously been trickier. If we look at that line (dark blue) it becomes very apparent that almost the entirety of those market returns was delivered in that first five-year period. This is when the accelerated growth of China (and commodity-oriented markets that benefited from the growth of China) drove prices substantially higher. During this time the US, to an extent, was still recovering from the dotcom bubble bursting and then leading into the global financial crisis with that famous lost decade of the 2000s.
What we would highlight, however, is that investing in US equities now is a different proposition than investing there coming out of the financial crisis. The valuation story is extremely different, with the average stock trading at about 18 times expected earnings for the year ahead. That’s a pretty aggressive price to earnings ratio, a measure of valuation ratio relative to historic experience. Profits will need to beat expectations for share prices to appear more reasonable value.
Emerging markets have had a very different experience and they are now trading at significant discounts compared to other regions. These discounts reflect lower levels of confidence in the rate of economic growth in China and greater concern over investor protections within the Chinese market as well as the political risk. Investors inherently are requiring a higher future rate of return for the risks they are taking on. Performance will improve if, and when, one or more of these concerns subside.
Performance after fees is key
The above attributes are the key factors you should consider when thinking about markets. While we invest primarily on a passive basis, sometimes people ask us what would change that. We do invest in some actively managed, or structured ETFs for specific reasons, but we envisage staying true to this idea that most of our portfolios’ assets will be invested passively – and there’s a reason for that.
We show a snapshot of performance below in major asset classes – the UK equity market, the US, Europe, Japan, emerging markets and UK government bonds (gilts). Through these different periods, from the relatively short term up to five years, we look at whether an ETF has outperformed the average active manager in this space. The results are compelling, and this is an ongoing story we have seen since our portfolios started.
Which strategy has performed better – ETFs or using the average active manager?
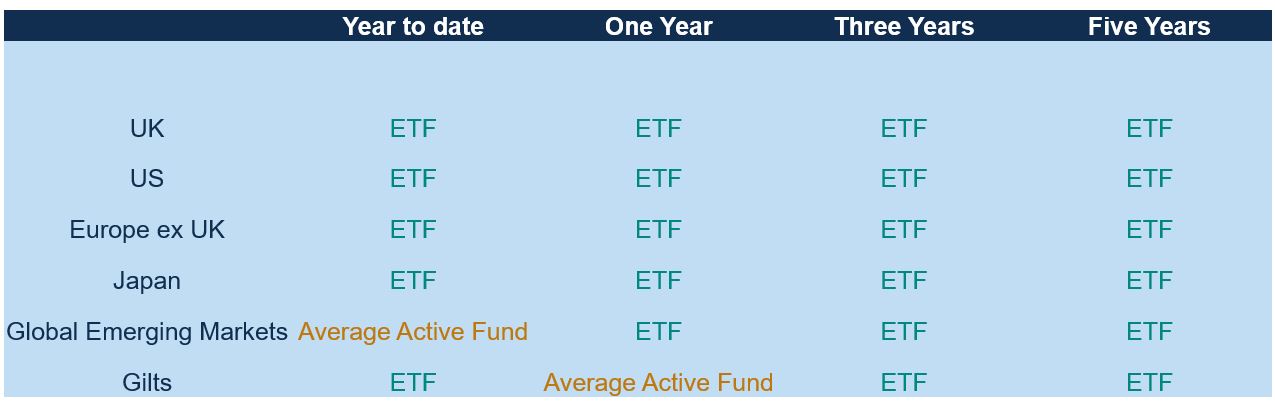
Past performance is not indicative of future results.
Source: Bloomberg, Investor Association and Morningstar, with Netwealth calculations. Returns in GBP, after fees. Data as of 30th September 2023.
As we can see, in aggregate active managers find it very difficult to consistently outperform their benchmarks and even an ETF after the costs of investing in an ETF is taken into consideration. Unless investors have conviction in their ability to identify the best managers for the future, investing as efficiently possible to take the market exposure you want seems very logical to us.
A further point is the magnitude of performance which is not shown in the table. So far in 2023, the average emerging markets active fund has outperformed the relevant ETF by 0.2%. But looking at more meaningful, longer-time periods, the average active fund has underperformed by more than 1.5% per annum in both UK and US equity markets. This compounds to a huge difference in relative outcomes.
These results give us great confidence that our approach is unlikely to change in a meaningful way. Active managers find it very difficult – for a wide range of reasons, and despite all their hard work – to deliver steady outperformance. That’s the justification for investing as we do.
An example of how our approach takes shape
Below you can see the allocations to one of our risk level 5 portfolios. And while we talk about investing on a passive basis, on the left you can see that we can really get quite granular in terms of the instruments we use to build portfolios.
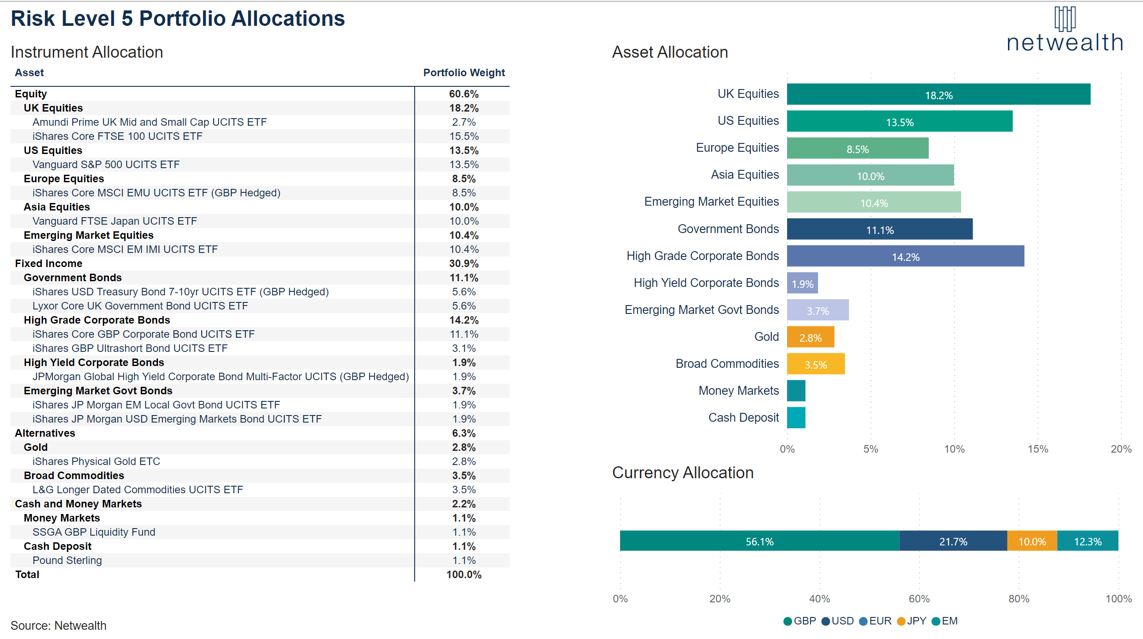
Most investments on the left are passive instruments, but we can be relatively targeted in how we put the portfolio together. We can combine the different instruments that really adhere to the allocations we are most keen on. This flexibility, combined with our innate efficiency, is what has delivered strong returns for clients in the seven-plus years we have been running these strategies.
You can read about our performance in more detail here, and if you would like to know more about how we can help you please get in touch.
Please note, the value of your investments can go down as well as up.

