The Remarkable Impact of Lower Fees
How fee savings add up meaningfully over time
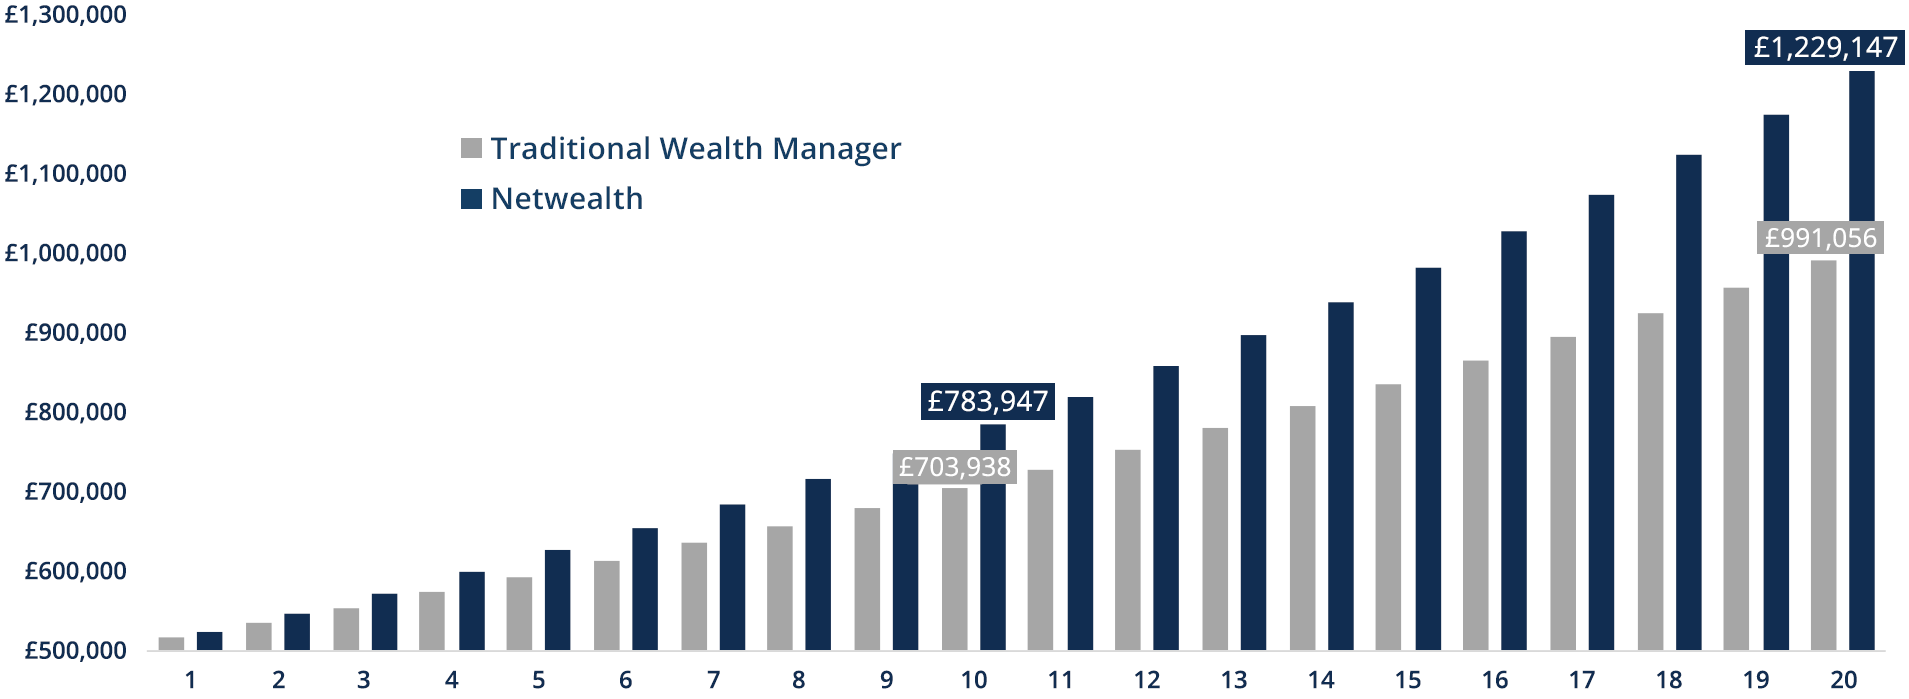
If we take an investment of £500,000 in our medium risk level portfolio (level 4) we can see how quickly the values add up – when you compare our fees to the average fee of traditional wealth managers.* After only 10 years of investing there is a difference of over £80,000, and nearly £240,000 after 20 years, based on the same gross investment returns but with a fee difference of 1%.
This 11th February article in the Telegraph also highlights the destructive nature of high fees.
Illustration 1: Investing £500,000 in medium risk portfolios over 20 years

Source: Source: Numis Securities, Citywire, Netwealth. Based on forward looking expected return for our medium risk portfolio (level 4) of 5.3%, gross of fees, and assuming all-in charges of 1.82% for Traditional and 0.7% for Netwealth.
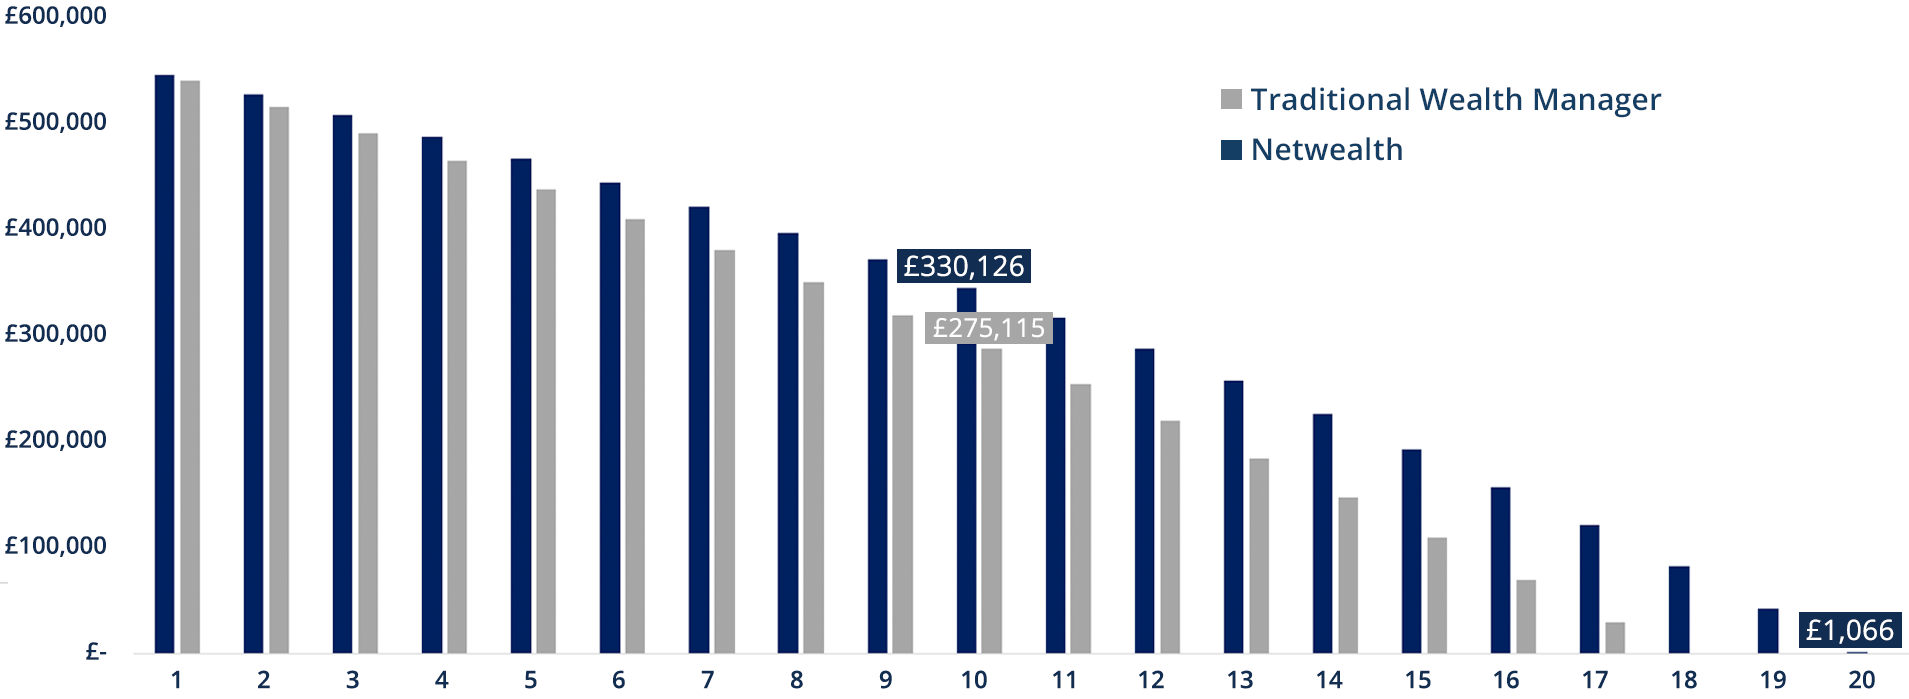
You can equally see the significant impact this fee reduction can make upon retirement income drawdown, and how much longer this pot could last as a result. In this example, we consider a portfolio of £500,000 where a client is drawing £40,000 per annum. The portfolio with lower fees lasts for three years longer, based on the same gross investment returns but with 1% lower fees.
Illustration 2: Value of £500,000 over time, with £40,000 withdrawn each year

Source: Netwealth. Based on forward looking expected return for our medium risk portfolio (level 4) of 5.3%, gross of fees, and assuming all-in charges of 1.82% for Traditional and 0.7% for Netwealth. We assume that £40,000 is deducted annually and the figures shown are the year-end values prior to the withdrawal.
Performance varies, but the impact of fees is a certainty
The additional costs typically associated with a traditional wealth manager are often associated with:
- Higher costs from the wealth manager themselves, often with the justification of a "bespoke portfolio", which in our view is often not the right way to have your money managed; and;
- The use of active underlying fund investments, which in many mainstream markets repeatedly underperform their passive equivalent on average, as we show here.
Yet while the performance of markets and wealth managers will always vary, the value of lower fees for investors is indisputable.
Therefore, we should always carefully consider how much we pay to manage our money – and examine just how much even a 1% difference could make to our circumstances over time.
Please remember that when investing your capital is at risk.
* The traditional wealth manager all-in fee of 1.82% is calculated as the average total expense ratio (TER) of the wealth managers listed in research by Numis and Citywire published by Citywire Wealth Manager in February 2015. The TER for Netwealth is calculated as 0.7% based on the 0.35% all-in fee and 0.30% of estimated all-in underlying fund costs and 0.05% of estimated annual costs of trading. Please note that forward looking models are not a reliable indicator of future performance.